In [35]:
import numpy as np
from matplotlib import pyplot as plt # for plotting
from random import randint # for sorting and creating data pts
from math import atan2 # for computing polar angle
import math
from manim import *
Motiváció
Néhány felhasználási terület:
- Számítógépes grafika
- Robotika
- GIS (Geographic information system) Földrajzi adatok
- Computer aided design (CAD) Számítógépes tervezés. Pl lézervágás, nyomtatás
- Biológiai modellezés molecular modeling
- Önvezető autók
A bonyolultabb geometriai feladatok általában egyszerűbb elemekből építkeznek:
- Objektumok metszetének kiszámítása
- Három pont egy egyenesen van-e?
- Konvex burok számítása
- Több térkép (szakasz rendszer) egyesítése
- Hatékony geometriai adatstruktúra építése
- Útkeresés geometriai környezetben
- Voronoi diagram, Delaunay háromszögelés
Különleges hibalehetőségek lépnek elő
- Degenerált esetek
- Számítási hibák

Triviális ötlet: Minden pontpárra nézzük meg, hogy a szélén van-e.
Futásidő: $O(n^3)$
Hogyan nézzük, hogy a szélén van-e?
Determináns számítással!
In [6]:
# 	[p1(x) p1(y) 1]
#	[p2(x) p2(y) 1]
# 	[p3(x) p3(y) 1]
# If >0 pozitív körüljárás (p3 a p1p2 vektor bal oldalán van)
# If <0 negatív körüljárás
# If =0 kollineáris
def det(p1,p2,p3):
    return   (p2[0]-p1[0])*(p3[1]-p1[1])-(p2[1]-p1[1])*(p3[0]-p1[0])
Graham scan algoritmus
- Keressük meg a legkisebb $y$ koordinátájú $p$ pontot, innen indulunk. Ez biztosan a konvex burkon van.
- $p$ ből körbenézve rendezzük a pontokat szög szerint
- A rendezés szerint végigmegyünk a pontokon. Az adott pontot mindig hozzávesszük a burokhoz. Ha egy "rosz irányú" törés jön létre a burkon akkor töröljük az ott lévő pontot a burkunkról.

Futásidő elemzés
- $y$ szerinti minimum: $O(n)$
- Rendezés: $O(n\log(n))$
- Burok felépítése: $O(n)$. Minden pontot legfeljebb egyszer dobunk ki!
Lehetne-e jobb a futásidő?
Nem, mivel a konvex burok használható rendezésre, és azt nem lehet kevesebből.
De mégis! Ha a konvex burok mérete $h$ akkor létezik $n\log(h)$ algoritmus. (Chan's algorithm)
Megvalósítás
In [37]:
num_of_points=20
x_cord=7*np.random.rand(num_of_points)-3.5
y_cord=7*np.random.rand(num_of_points)-3.5
points=list(zip(x_cord,y_cord))
points
Out[37]:
In [38]:
def polar_angle(p0,p1=None):
    if p1==None: p1=anchor
    y_span=p0[1]-p1[1]
    x_span=p0[0]-p1[0]
    return atan2(y_span,x_span)
In [39]:
# Returns the euclidean distance from p0 to p1,
# square root is not applied for sake of speed.
# If p1 is None, defaults to replacing it with the
# global variable 'anchor', normally set in the
# 'graham_scan' function.
def distance(p0,p1=None):
    if p1==None:
        p1=anchor
    y_span=p0[1]-p1[1]
    x_span=p0[0]-p1[0]
    return y_span**2 + x_span**2
In [40]:
# Returns the determinant of the 3x3 matrix...
# 	[p1(x) p1(y) 1]
#	[p2(x) p2(y) 1]
# 	[p3(x) p3(y) 1]
# If >0 then counter-clockwise
# If <0 then clockwise
# If =0 then collinear
def det(p1,p2,p3):
    return   (p2[0]-p1[0])*(p3[1]-p1[1])-(p2[1]-p1[1])*(p3[0]-p1[0])
In [41]:
# Sorts in order of increasing polar angle from 'anchor' point.
# 'anchor' variable is assumed to be global, set from within 'graham_scan'.
# For any values with equal polar angles, a second sort is applied to
# ensure increasing distance from the 'anchor' point.
def quicksort(a):
    if len(a)<=1: return a
    smaller,equal,larger=[],[],[]
    piv_ang=polar_angle(a[randint(0,len(a)-1)]) # select random pivot
    for pt in a:
        pt_ang=polar_angle(pt) # calculate current point angle
        if   pt_ang<piv_ang:  smaller.append(pt)
        elif pt_ang==piv_ang: equal.append(pt)
        else: 				  larger.append(pt)
    return   quicksort(smaller)+sorted(equal,key=distance)+quicksort(larger)
In [47]:
# Returns the vertices comprising the boundaries of
# convex hull containing all points in the input set.
# The input 'points' is a list of (x,y) coordinates.
def graham_scan(points,show_progress=False):
    hlista=[]  #ez csak a rajzoláshoz használom
    global anchor # to be set, (x,y) with smallest y value

    # Find the (x,y) point with the lowest y value,
    # along with its index in the 'points' list. If
    # there are multiple points with the same y value,
    # choose the one with smallest x.
    min_idx=None
    for i,(x,y) in enumerate(points):
        if min_idx==None or y<points[min_idx][1]:
            min_idx=i
        if y==points[min_idx][1] and x<points[min_idx][0]:
            min_idx=i

    # set the global variable 'anchor', used by the
    # 'polar_angle' and 'distance' functions
    anchor=points[min_idx]

    # sort the points by polar angle then delete
    # the anchor from the sorted list
    sorted_pts=quicksort(points)
    del sorted_pts[sorted_pts.index(anchor)]

    # anchor and point with smallest polar angle will always be on hull
    hull=[anchor,sorted_pts[0]]
    for s in sorted_pts[1:]:
        while det(hull[-2],hull[-1],s)<=0: #amíg rossz irányba kanyarodik a vége törülünk.

            hull.append(s)                 #rajzoláshoz
            hlista.append(hull.copy())     #rajzoláshoz
            hull.pop()                     #rajzoláshoz

            del hull[-1] # backtrack

        hull.append(s)

        hlista.append(hull.copy())
    return hull, hlista

# For each size in the 'sizes' list, compute the average
In [49]:
ch=graham_scan(points,True)
print(ch)
In [50]:
## Hibalehetőségek

points=[(0,0),(-1,0),(1,0),(1,1),(2,1),(2,2)]
ch=graham_scan(points,True)
print(ch)
Manim csomag
Szükséges hozzá néhány dolog
- latex fordító
- ffmpeg
Matematikai animáció készítésére alkalmas python csomag
- Latex támogatás
- videót készít
Gondolatok:
- animációkról általában
- vektor grafikus vs raszteres
- gépigényes
- megjelenés és számítás elválasztása
Vektor grafikus vs raszteres képek
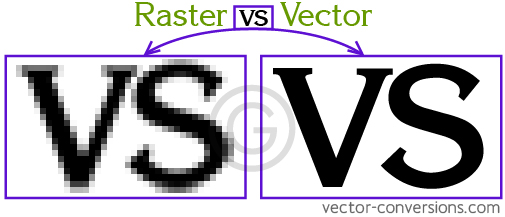
Raszteres
- Nem lehet nagyítani
- Van amikor, elkerülhetetlen, pl fotók
- Hatékonyabb bonyolult képek esetén
- Elterjedtebb
- Nehéz vektorossá konvertálni
Vektoros
- Matekos gondolkodáshoz közelebb van
- Hatékonyabb egyszerű képek esetén,
- Kicsi kép méret nagy méretű kép esetén is
- Tetszőlegesen nagyítható
- Könnyű raszteressé konvertálni
Keyframes

In [51]:
%%manim  -qm -v WARNING SquareToCircle

class SquareToCircle(Scene):
   def construct(self):
      square = Square()
      circle = Circle()
      circle.set_fill(PINK, opacity=0.5)
      self.play(Create(square))
      self.play(Transform(square, circle))
      self.wait()
In [34]:
%%manim  -qm -v WARNING MovingFrameBox

class MovingFrameBox(Scene):
    def construct(self):
        text=MathTex(
            "\\frac{d}{dx}f(x)g(x)=","f(x)\\frac{d}{dx}g(x)","+",
            "g(x)\\frac{d}{dx}f(x)"
        )
        self.play(Write(text))
        framebox1 = SurroundingRectangle(text[1], buff = .1)
        framebox2 = SurroundingRectangle(text[3], buff = .1)
        self.play(
            Create(framebox1),
        )
        self.wait()
        self.play(
            ReplacementTransform(framebox1,framebox2),
        )
        self.wait()
In [12]:
%%manim  -qm -v WARNING PointWithTrace


class PointWithTrace(Scene):
    def construct(self):
        path = VMobject()
        dot = Dot()
        path.set_points_as_corners([dot.get_center(), dot.get_center()])
        def update_path(path):
            previous_path = path.copy()
            previous_path.add_points_as_corners([dot.get_center()])
            path.become(previous_path)
        path.add_updater(update_path)
        self.add(path, dot)
        self.play(Rotating(dot, radians=PI, about_point=RIGHT, run_time=2))
        self.wait()
        self.play(dot.animate.shift(UP))
        self.play(dot.animate.shift(LEFT))
        self.wait()
In [31]:
%%manim  -qm -v WARNING SinAndCosFunctionPlot

class SinAndCosFunctionPlot(Scene):
    def construct(self):
        axes = Axes(
            x_range=[-10, 10.3, 1],
            y_range=[-1.5, 1.5, 1],
            x_length=10,
            axis_config={"color": GREEN},
            x_axis_config={
                "numbers_to_include": np.arange(-10, 10.01, 2),
                "numbers_with_elongated_ticks": np.arange(-10, 10.01, 2),
            },
            tips=False,
        )
        axes_labels = axes.get_axis_labels()
        sin_graph = axes.plot(lambda x: np.sin(x), color=BLUE)
        cos_graph = axes.plot(lambda x: np.cos(x), color=RED)

        sin_label = axes.get_graph_label(
            sin_graph, "\\sin(x)", x_val=-10, direction=UP / 2
        )
        cos_label = axes.get_graph_label(cos_graph, label="\\cos(x)")

        vert_line = axes.get_vertical_line(
            axes.i2gp(TAU, cos_graph), color=YELLOW, line_func=Line
        )
        line_label = axes.get_graph_label(
            cos_graph, "x=2\pi", x_val=TAU, direction=UR, color=WHITE
        )

        plot = VGroup(axes, sin_graph, cos_graph, vert_line)
        labels = VGroup(axes_labels, sin_label, cos_label, line_label)
        self.add(plot, labels)

Rajzolás
In [44]:
def tortline(bpoints):
    points_in3d=[(x[0],x[1],0) for x in bpoints]
    vg = VGroup()
    for first, second in zip(points_in3d, points_in3d[1:]):
        vg.add(Line(first, second))
    return vg
In [45]:
def my_line_transform(self,points1,points2):
    if points1==points2:
        self.wait(1)
    if len(points1)==len(points2) and points1[:-1]==points2[:-1]:
        t=tortline(points1)
        t2=tortline(points2)
        self.play(ReplacementTransform(t1, t2),run_time=2)

        self.remove(t1)
        self.remove(t2)
    if len(points1)==len(points2)+1 and points1[:-2]==points2[:-1]:
        p3=points2[:-1].copy()
        p3.append(((points2[-1][0]+points2[-2][0])/2,(points2[-1][1]+points2[-2][1])/2))
        p3.append(points2[-1])
        t1=tortline(points1)
        t2=tortline(p3)
        self.play(ReplacementTransform(t1, t2),run_time=2)
        self.remove(t1)
        self.remove(t2)
    if len(points1)+1==len(points2) and points1[:]==points2[:-1]:

        t1=tortline(points1)
        self.add(t1)
        t2=tortline(points2[-2:])
        self.play(FadeIn(t2),run_time=2)
        self.remove(t1)
        self.remove(t2)
In [46]:
%%manim -ql -v WARNING Hulla
class Hulla(Scene):
    def construct(self):
        self.wait(2)
        dots=VGroup(*[Dot(point=(x[0],x[1],0)) for x in points])
        self.play(FadeIn(dots),run_time=2)
        #for x in dots:
        #    self.add(x)

        for first, second in zip(ch[1], ch[1][1:]):
            my_line_transform(self,first,second)

        final_hull=ch[1][-1].copy()
        final_hullb=ch[1][-1].copy()

        final_hullb.append(final_hull[0])

        my_line_transform(self,final_hull,final_hullb)

        self.add(tortline(final_hullb))
        self.wait(5)
In [ ]:
In [14]:
# Returns a list of (x,y) coordinates of length 'num_points',
# each x and y coordinate is chosen randomly from the range
# 'min' up to 'max'.
def create_points(ct,min=0,max=50):
    return [[randint(min,max),randint(min,max)] for _ in range(ct)]

# Creates a scatter plot, input is a list of (x,y) coordinates.
# The second input 'convex_hull' is another list of (x,y) coordinates
# consisting of those points in 'coords' which make up the convex hull,
# if not None, the elements of this list will be used to draw the outer
# boundary (the convex hull surrounding the data points).
def scatter_plot(coords,convex_hull=None):
    xs,ys=zip(*coords) # unzip into x and y coord lists
    plt.scatter(xs,ys) # plot the data points

    if convex_hull!=None:
        # plot the convex hull boundary, extra iteration at
        # the end so that the bounding line wraps around
        #for i in range(1,len(convex_hull)+1):
        for i in range(1,len(convex_hull)):
            if i==len(convex_hull): i=0 # wrap
            c0=convex_hull[i-1]
            c1=convex_hull[i]
            plt.plot((c0[0],c1[0]),(c0[1],c1[1]),'r')
    plt.show()


# Returns the polar angle (radians) from p0 to p1.
# If p1 is None, defaults to replacing it with the
# global variable 'anchor', normally set in the
# 'graham_scan' function.
def polar_angle(p0,p1=None):
    if p1==None: p1=anchor
    y_span=p0[1]-p1[1]
    x_span=p0[0]-p1[0]
    return atan2(y_span,x_span)


# Returns the euclidean distance from p0 to p1,
# square root is not applied for sake of speed.
# If p1 is None, defaults to replacing it with the
# global variable 'anchor', normally set in the
# 'graham_scan' function.
def distance(p0,p1=None):
    if p1==None:
        p1=anchor
    y_span=p0[1]-p1[1]
    x_span=p0[0]-p1[0]
    return y_span**2 + x_span**2


# Returns the determinant of the 3x3 matrix...
# 	[p1(x) p1(y) 1]
#	[p2(x) p2(y) 1]
# 	[p3(x) p3(y) 1]
# If >0 then counter-clockwise
# If <0 then clockwise
# If =0 then collinear
def det(p1,p2,p3):
    return   (p2[0]-p1[0])*(p3[1]-p1[1])-(p2[1]-p1[1])*(p3[0]-p1[0])


# Sorts in order of increasing polar angle from 'anchor' point.
# 'anchor' variable is assumed to be global, set from within 'graham_scan'.
# For any values with equal polar angles, a second sort is applied to
# ensure increasing distance from the 'anchor' point.
def quicksort(a):
    if len(a)<=1: return a
    smaller,equal,larger=[],[],[]
    piv_ang=polar_angle(a[randint(0,len(a)-1)]) # select random pivot
    for pt in a:
        pt_ang=polar_angle(pt) # calculate current point angle
        if   pt_ang<piv_ang:  smaller.append(pt)
        elif pt_ang==piv_ang: equal.append(pt)
        else: 				  larger.append(pt)
    return   quicksort(smaller)+sorted(equal,key=distance)+quicksort(larger)


# Returns the vertices comprising the boundaries of
# convex hull containing all points in the input set.
# The input 'points' is a list of (x,y) coordinates.
# If 'show_progress' is set to True, the progress in
# constructing the hull will be plotted on each iteration.
def graham_scan(points,show_progress=False):
    hlista=[]
    global anchor # to be set, (x,y) with smallest y value

    # Find the (x,y) point with the lowest y value,
    # along with its index in the 'points' list. If
    # there are multiple points with the same y value,
    # choose the one with smallest x.
    min_idx=None
    for i,(x,y) in enumerate(points):
        if min_idx==None or y<points[min_idx][1]:
            min_idx=i
        if y==points[min_idx][1] and x<points[min_idx][0]:
            min_idx=i

    # set the global variable 'anchor', used by the
    # 'polar_angle' and 'distance' functions
    anchor=points[min_idx]

    # sort the points by polar angle then delete
    # the anchor from the sorted list
    sorted_pts=quicksort(points)
    del sorted_pts[sorted_pts.index(anchor)]

    # anchor and point with smallest polar angle will always be on hull
    hull=[anchor,sorted_pts[0]]
    for s in sorted_pts[1:]:
        while det(hull[-2],hull[-1],s)<=0:
            hull.append(s)
            hlista.append(hull.copy())
            scatter_plot(points,hull)
            hull.pop()
            del hull[-1] # backtrack
            #if len(hull)<2: break
        hull.append(s)
        if show_progress:
            scatter_plot(points,hull)
            hlista.append(hull.copy())
    return hull, hlista

# For each size in the 'sizes' list, compute the average

pts=create_points(10)
print("Points:",pts)
hull=graham_scan(pts,True)
print("Hull:",hull[1])
#scatter_plot(pts,hull)


In [ ]: